 |
OVERVIEW OF PRELIMINARY RESULTS (2008 study): Critical findings from the first study include the need for strong narrative and textual context when presenting science images, for explicit discussion of the colors and what they represent in science images, and for a clear sense of physical scale that is helpful for comprehension, across all levels of expertise. |
|
EXAMPLES WITH THE CHANDRA X-RAY OBSERVATORY Members of the Chandra X-ray Observatory's Education and Public Outreach (EPO) group were able to implement the study's results almost immediately. Being responsible for a major observatory's public website and other outreach materials allowed the A&A outcomes to quickly go from preliminary academic research to field-tested practices on a website that receives 250,000-300,000 visits per month. What changes did we make? First, we added bulleted text for each new image, interactive labeling, and put "Wikipedia-style" links in the body of the text. Each of these changes came out of the feedback we received during the online survey and focus groups. The next, more involved implementation of the A&A results was to develop an interactive multiwavelength image feature that allows the user to move from one energy band to another, and ultimately "build" the composite themselves. A sample of this can be found at https://chandra.si.edu/photo/2009/galactic/ The feedback from the public on these relatively simple changes to the website have been overwhelmingly positive, through our comment and rating sections. Our next step is to implement a questionnaire on the Chandra website to ask users specifically how these new features affect their enjoyment and comprehension of the image and the science behind it. We have also built an interactive, question-based text script into the Chandra photo pages with click-tracking methods to count the user clicks per question and per image, and to compare totals. We have done a similar implementation with a series of print products that includes posters featuring multiwavelength astronomical images (see Figure 1). Here, we use the tried and true series of questions: who, what, when, where, why, and how to engage the viewer in an approachable manner. The text highlights some of the content that was commonly asked during the focus groups including how the images were made, the historical importance of the object, the location in the night sky, etc. Data collection and a brief summative evaluation of these six posters are being conducted to analyze the impact of the improved features on the public's understanding. Another useful finding has been that many novices want to understand how the experts - the astrophysicists – view the images. This type of information could be provided with images in the future by having a "rollover" on the image that annotates, "Here is what astronomers see...", or by including video or audio commentary from astronomers available as supplementary digital materials. Read more at: http://www.capjournal.org/issues/10/10_13.php |
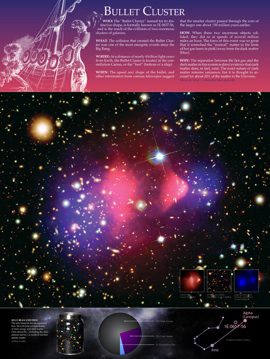 Figure 1. Sample of poster created using who, what, when, where, why, how questions, color coding and supporting informational graphics View larger (PDF) or view the complete collection of prints at Chandra |
